StoreHero: one true profit number out of scattered store data
StoreHero is a profitability dashboard for direct-to-consumer brands and the agencies that run their marketing. It exists because a store's numbers live in half a dozen places at once, its sales platform and each of its ad accounts, all counting the same conversion differently, so nobody can see one true profit figure. We did not start this product. We joined it part-built, made it work, and then kept extending it for years.
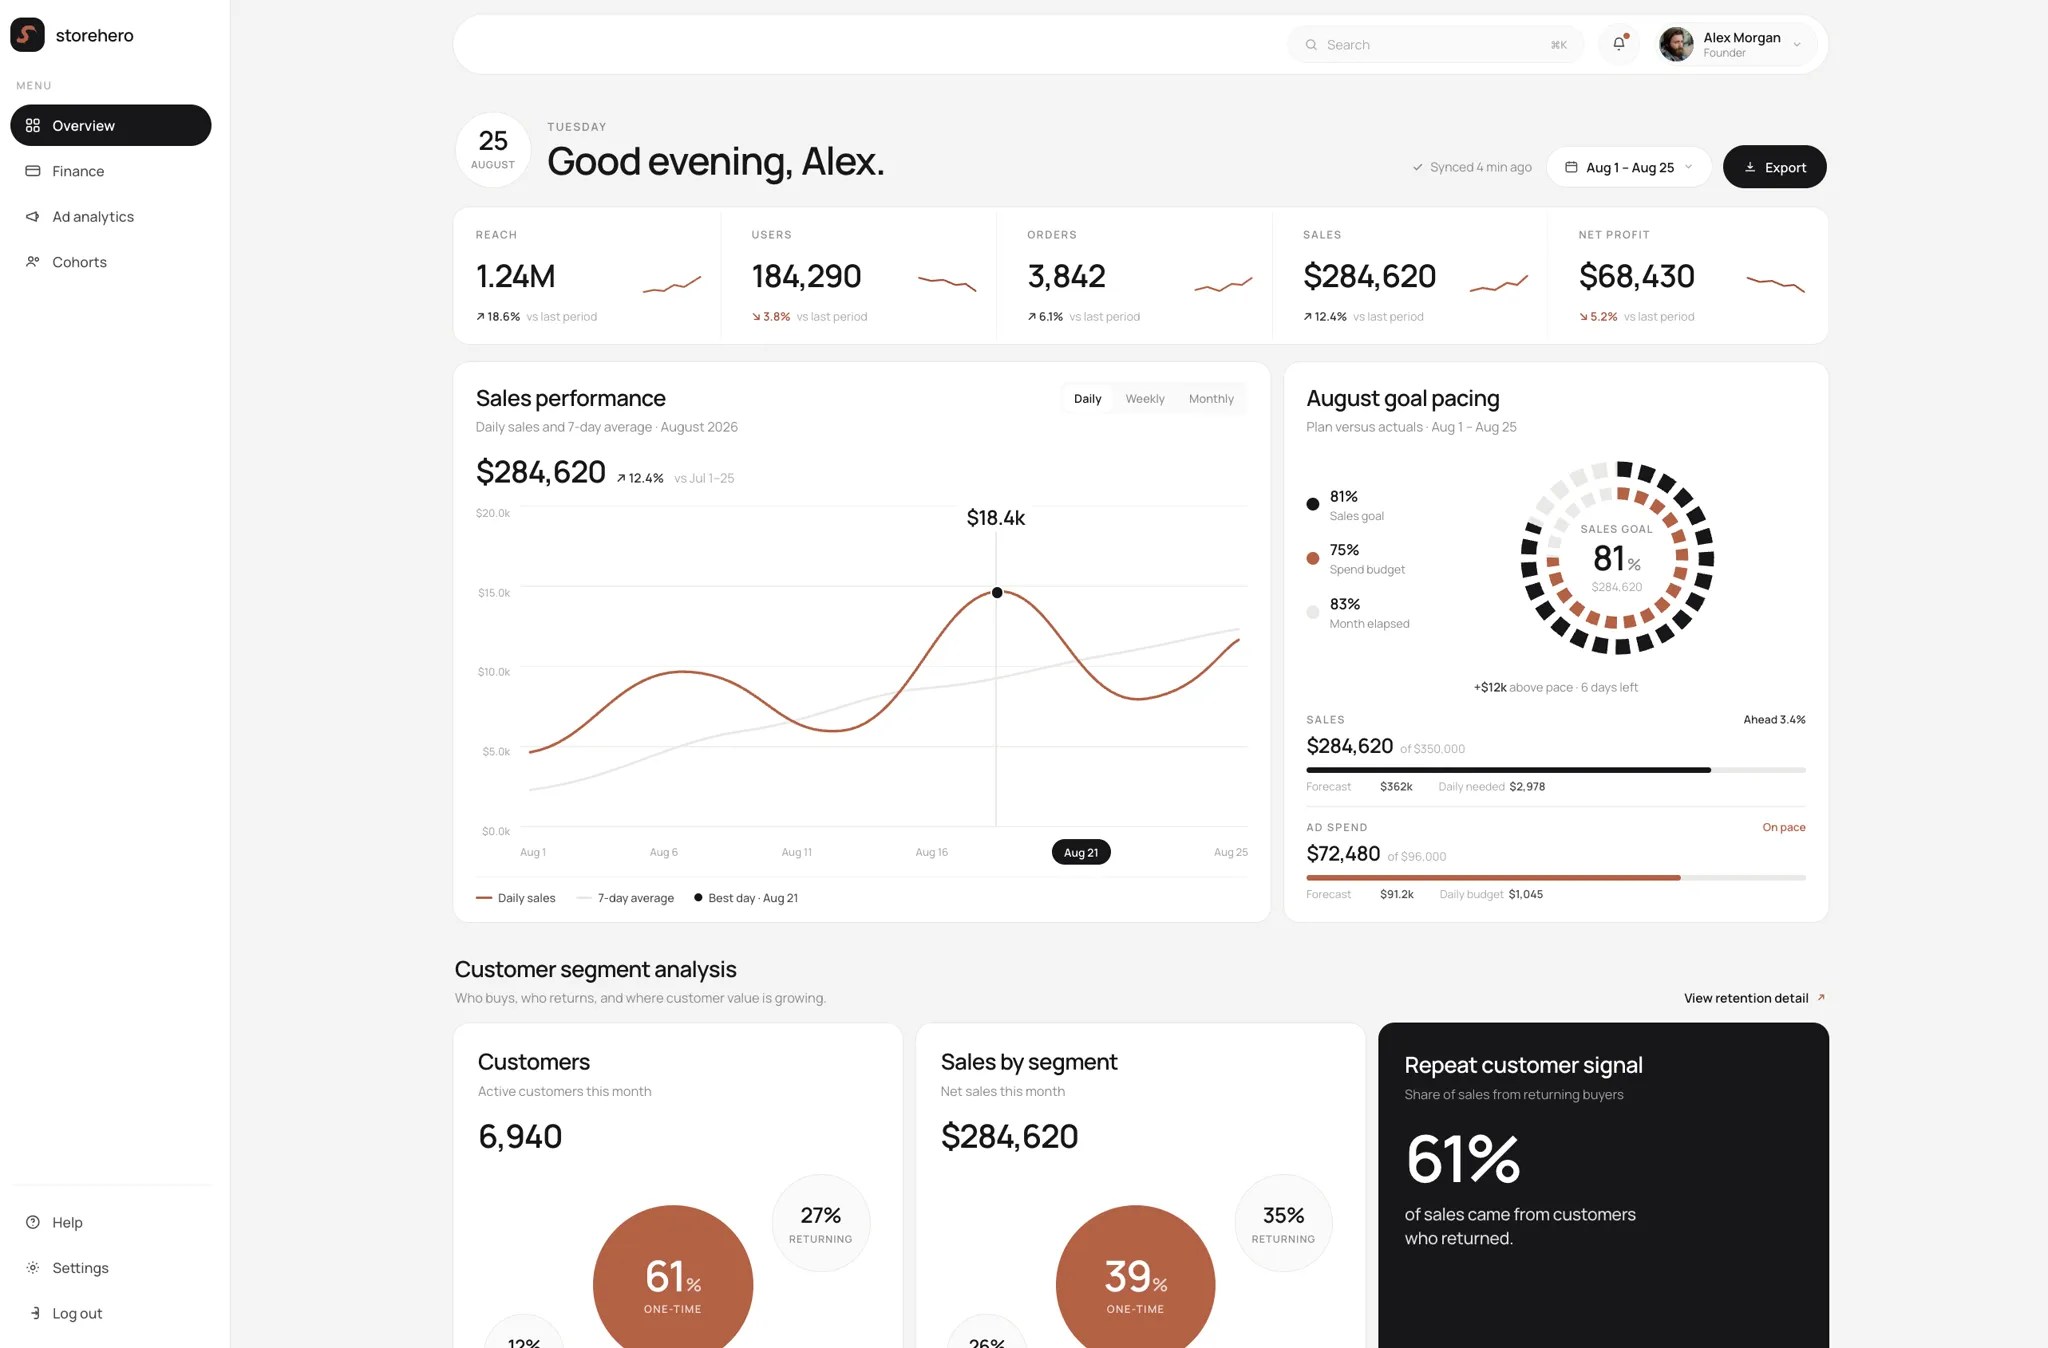
The overview tracks revenue, contribution margin and net profit against monthly targets, with forecasting for the rest of the period.
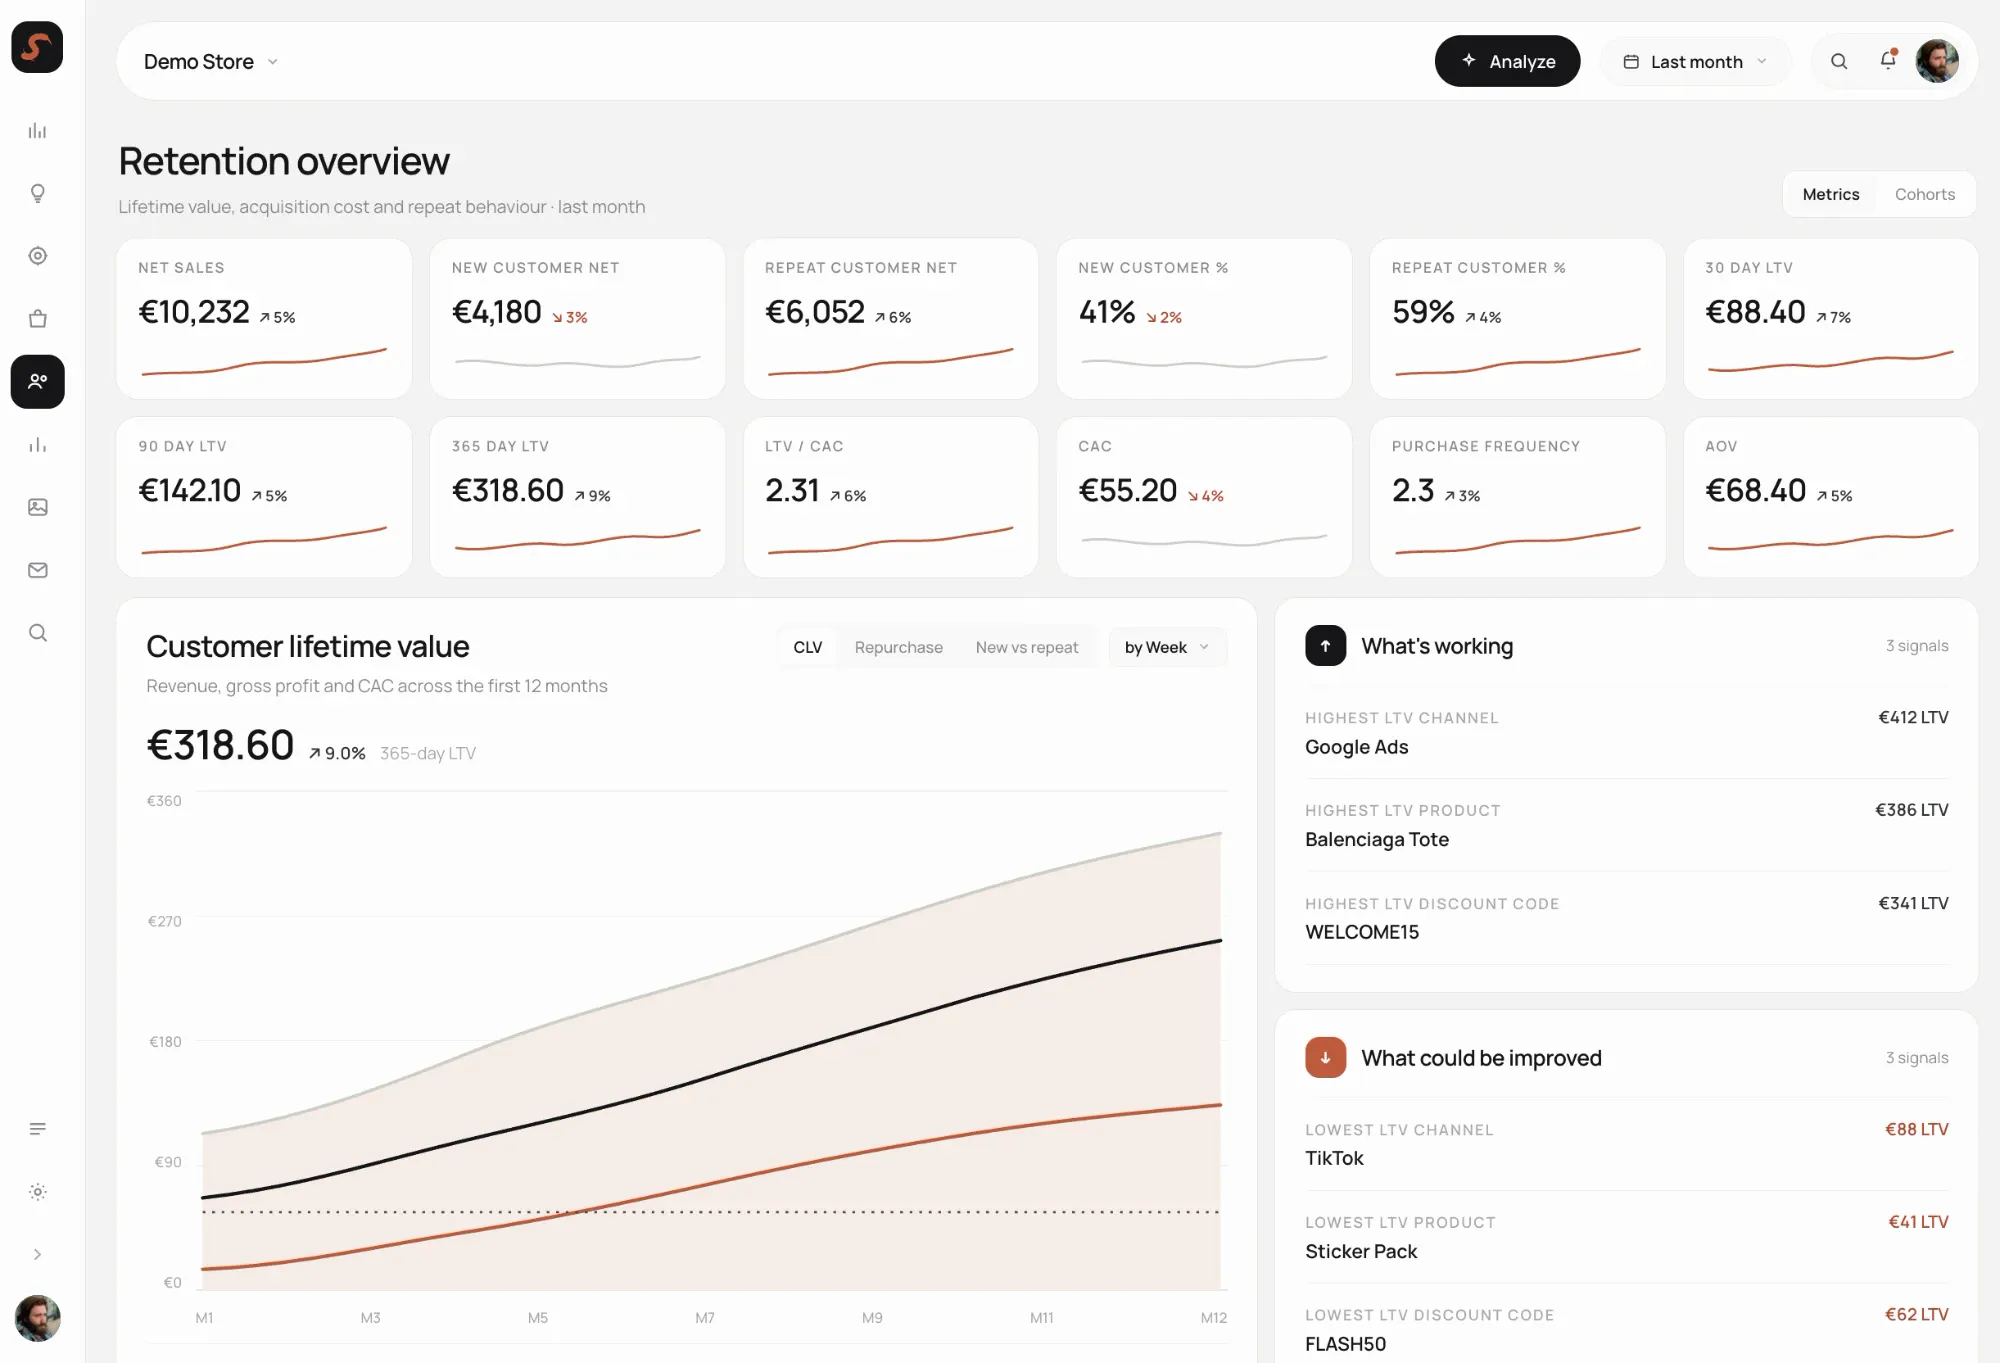
Retention curves and lifetime-value modelling show how long customers stay and what they are worth after acquisition cost.
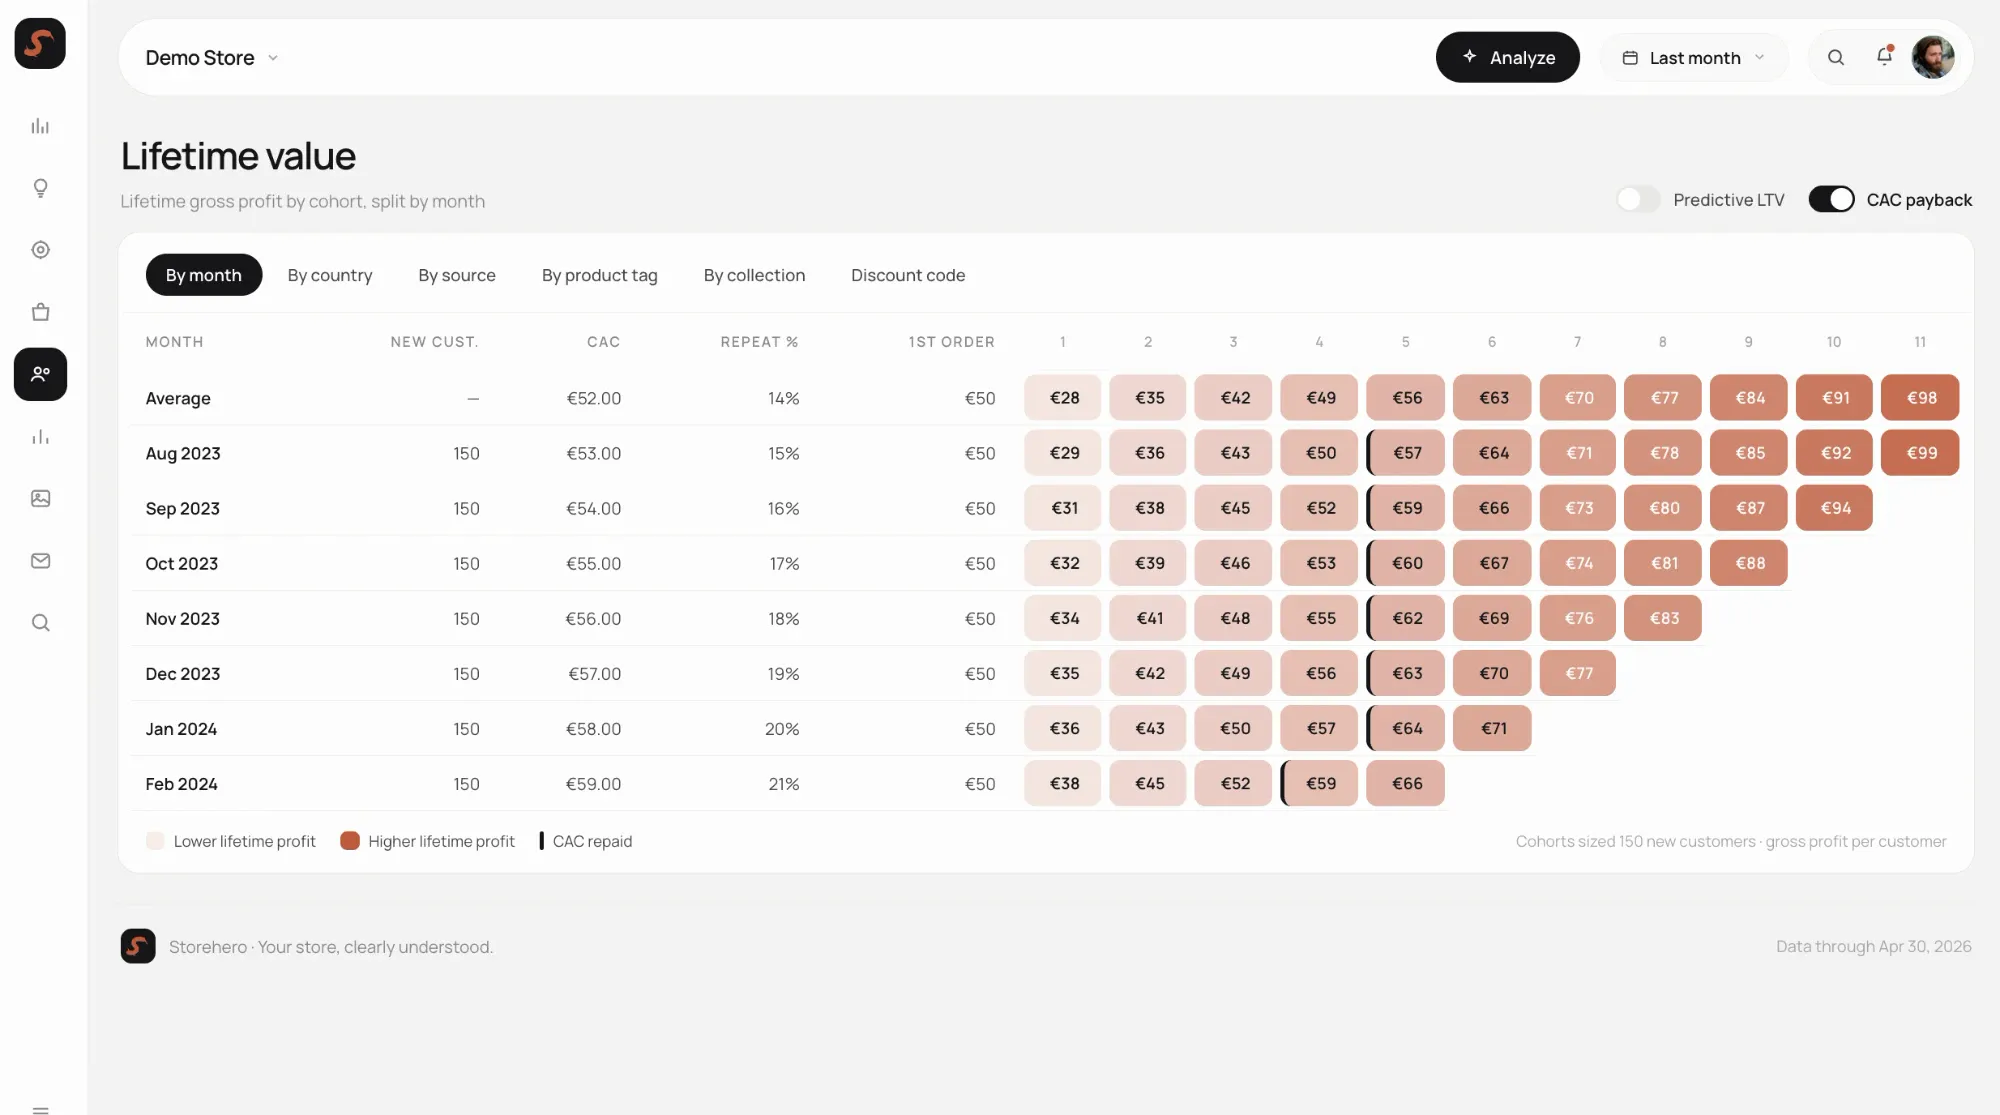
Cohort tables break down payback and revenue by acquisition month, so a brand can see which periods brought the best customers.
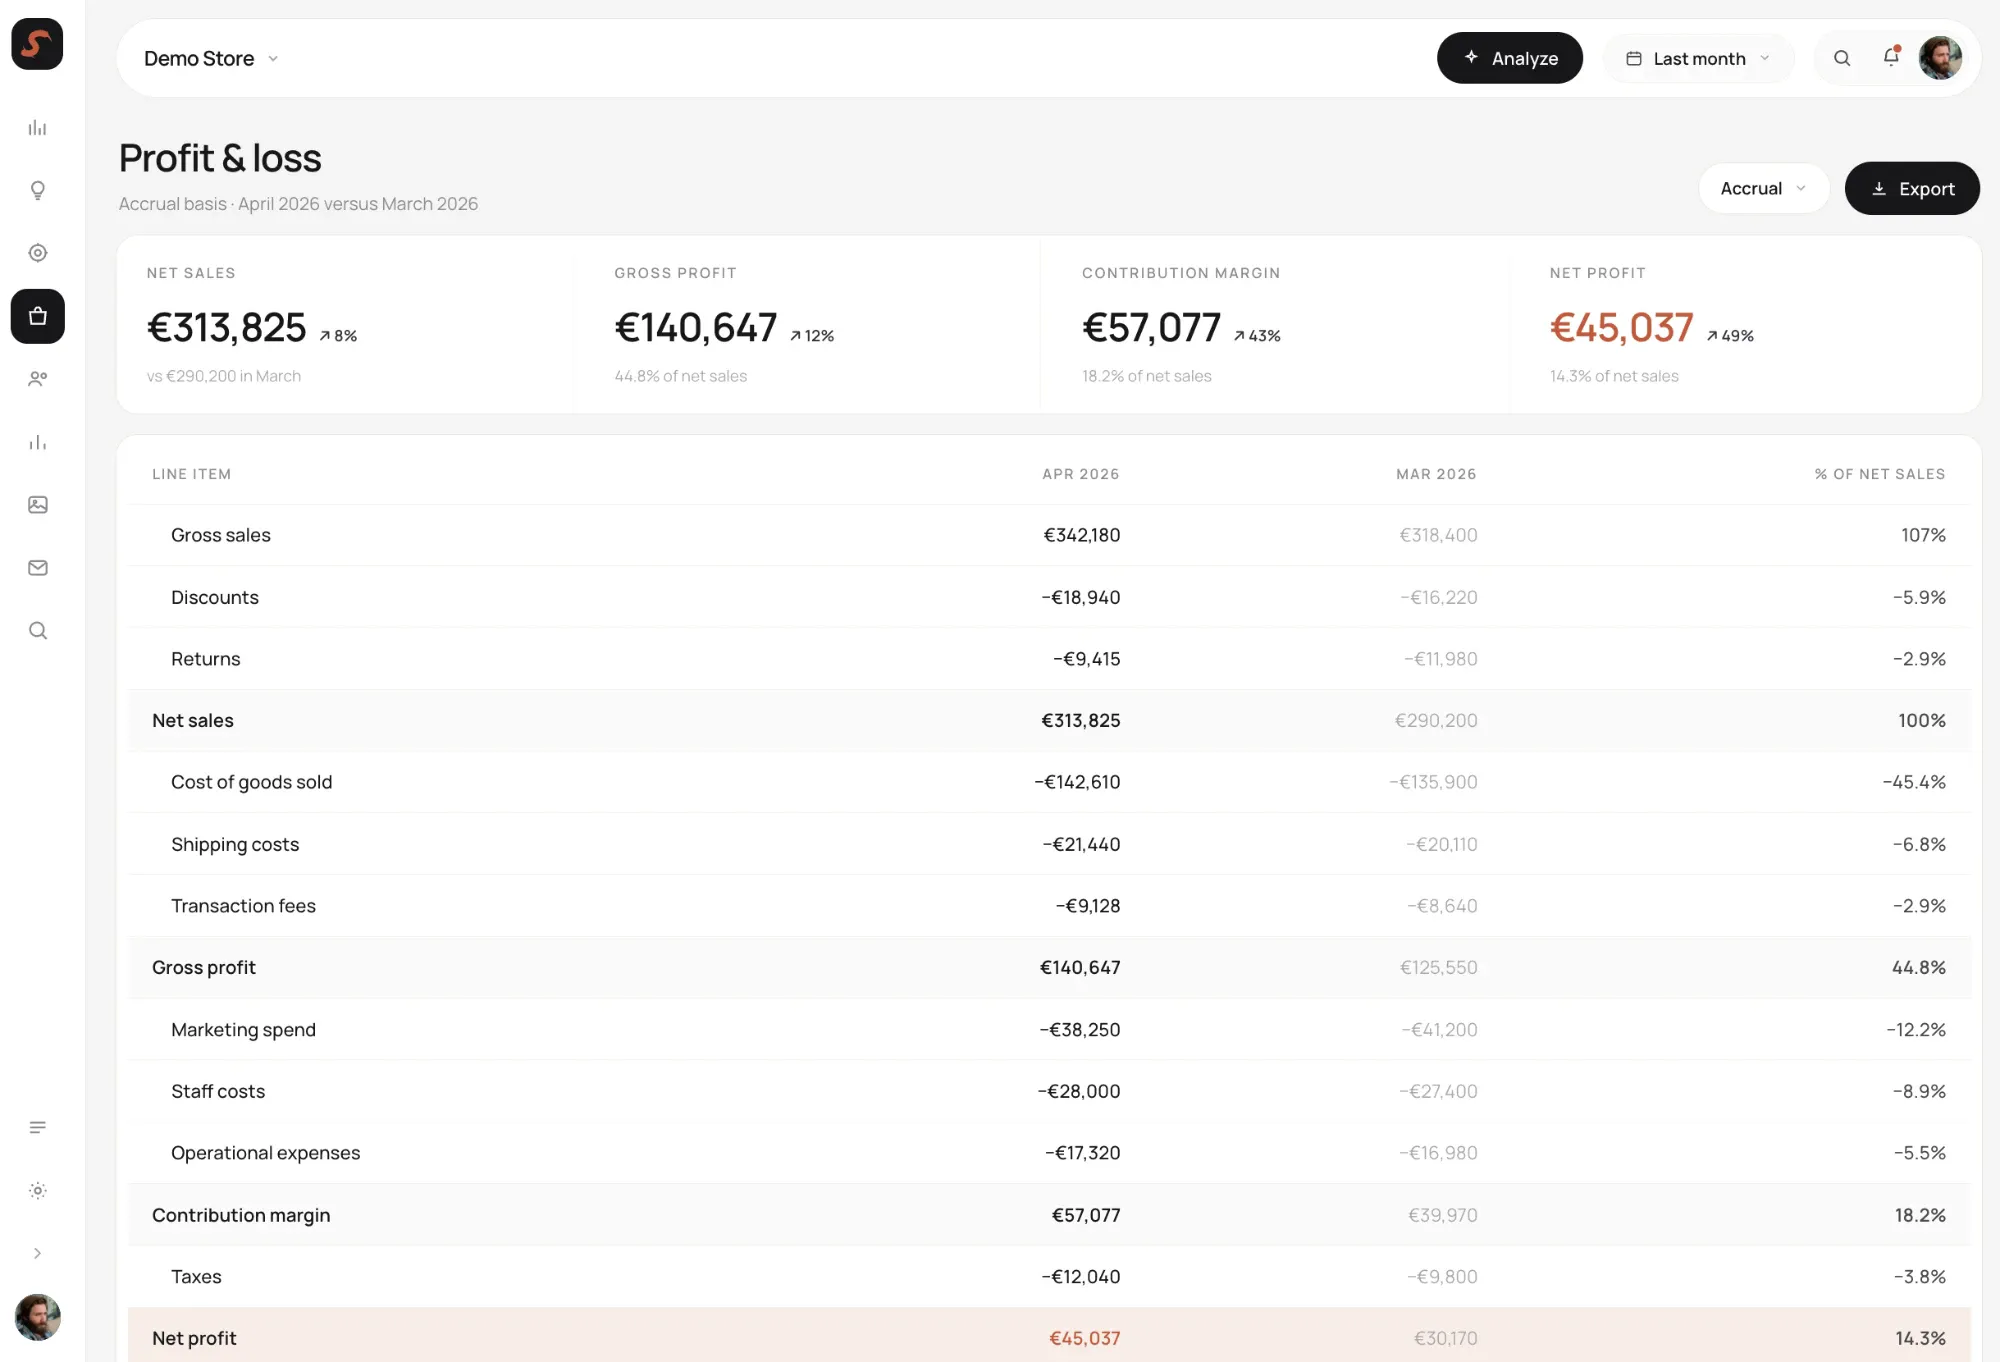
A full P&L statement rolls up every cost input (COGS, shipping, fees and operating expenses) into one net profit line.
- Ecommerce analytics and marketing
- Embedded front-end engineering, also carrying the QA function the client did not have
- React and TypeScript on the front end, against a GraphQL API living in the same monorepo, with Mixpanel for product analytics
StoreHero did not come to us as an idea. It came as an app, designed screen by screen by a founder who was himself a designer, and already partly built. That set the job: not to invent the product, but to make it work and then keep extending it. We started on fixes and improvements, moved into building new modules, and kept building them for years.
The hard part was never the dashboard. A chart is a chart. The difficulty sat one layer back, on the page where a store connects its sales platform and its ad accounts, because every one of those services reports differently and all of it has to arrive as one number a brand can act on. The client's own engineer owned that normalisation and we were the ones consuming it, so getting the two sides to agree took a long iterative loop rather than a specification handed over once, and the front end had to stay usable when a connected service was slow, down, or returning something nobody expected. There were no testers on the team either, so that work fell to us alongside the building: running the product hard, finding where the data coming back was wrong, and reporting it precisely enough to be actionable, round after round. It is unglamorous, and it is the reason the numbers on those dashboards could be trusted.
We also spoke up, and that was part of the job. The founder had designed every screen and was not an engineer, so some of what he asked for carried a cost out of proportion to its value, and some of it would not have worked once built. Taking the brief as given would have been the easy call and the wrong one. We explained what each request would actually cost, and where something would not hold we proposed an alternative that met the same expectation and would work as intended. Making that judgement and standing behind it is a large part of what a client is buying when the person on the other side designs but does not build.
Then the modules kept coming. Cross-channel ad attribution that de-duplicates conversions instead of letting every platform claim the same sale. An analyse feature that reads the numbers back in plain language. A white-label mode so an agency can put the dashboard in front of its own clients under its own brand. Cohort and payback modelling for customer lifetime value. Each arrived as a new stage of the product rather than as a second engagement, into a codebase we had by then been supporting for years.
The engagement ended because the goals were reached. The claim here is the work rather than a number: a product we did not start, extended module by module across years of support, and a client relationship that closed on its own terms rather than on a failure. No client-confirmed metric is published for this engagement.