SpaceOps: Real-time mission dashboards for aerospace simulation runs
SpaceOps runs aerospace simulations: satellites, aircraft, rockets and other airborne objects, each moving through a run with its position, altitude and speed changing every second. The client had a working API and nothing in front of it, so we built the whole interface, a general dashboard across all activity plus a page for every individual simulation. The hard part was not the picture but the pace, because an interface that redraws carelessly at one update per second stops being usable.
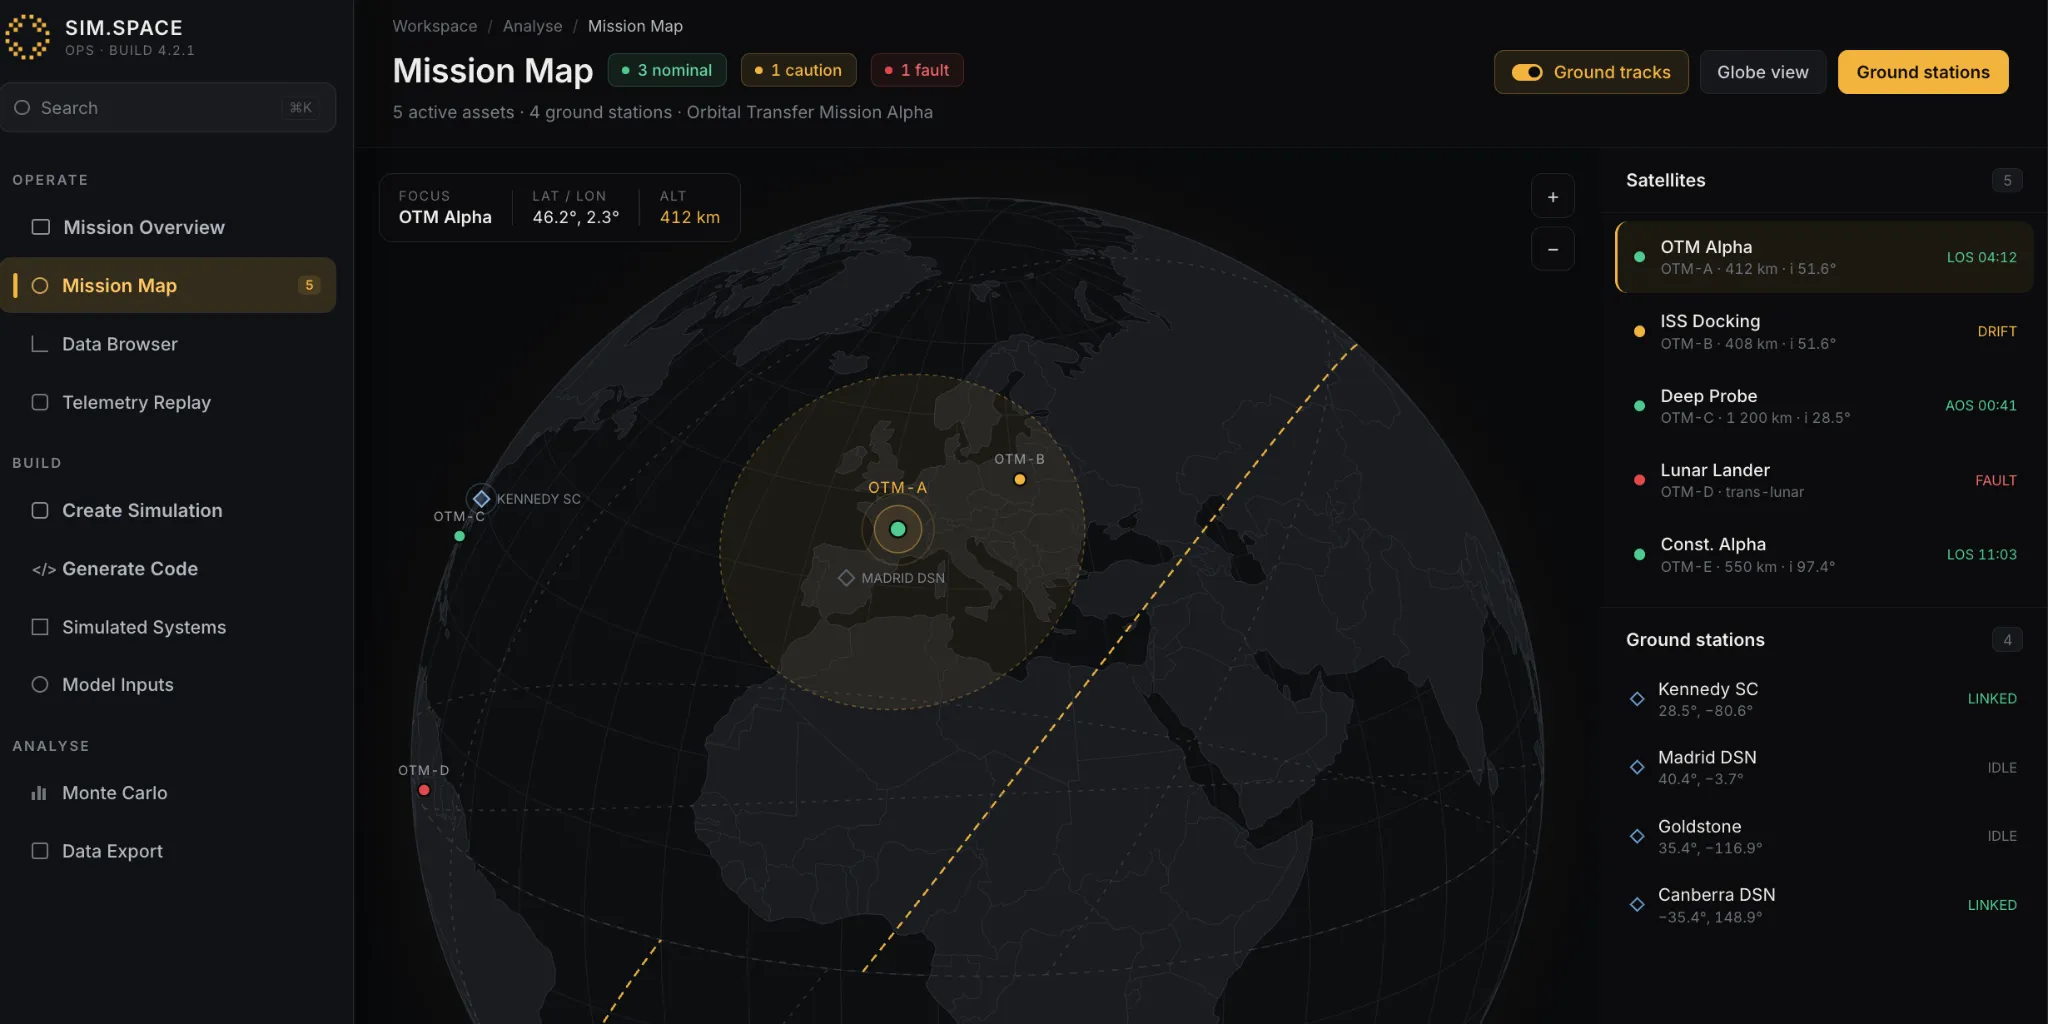
A live map tracks satellite and ground-station positions as telemetry streams in during an active simulation run.
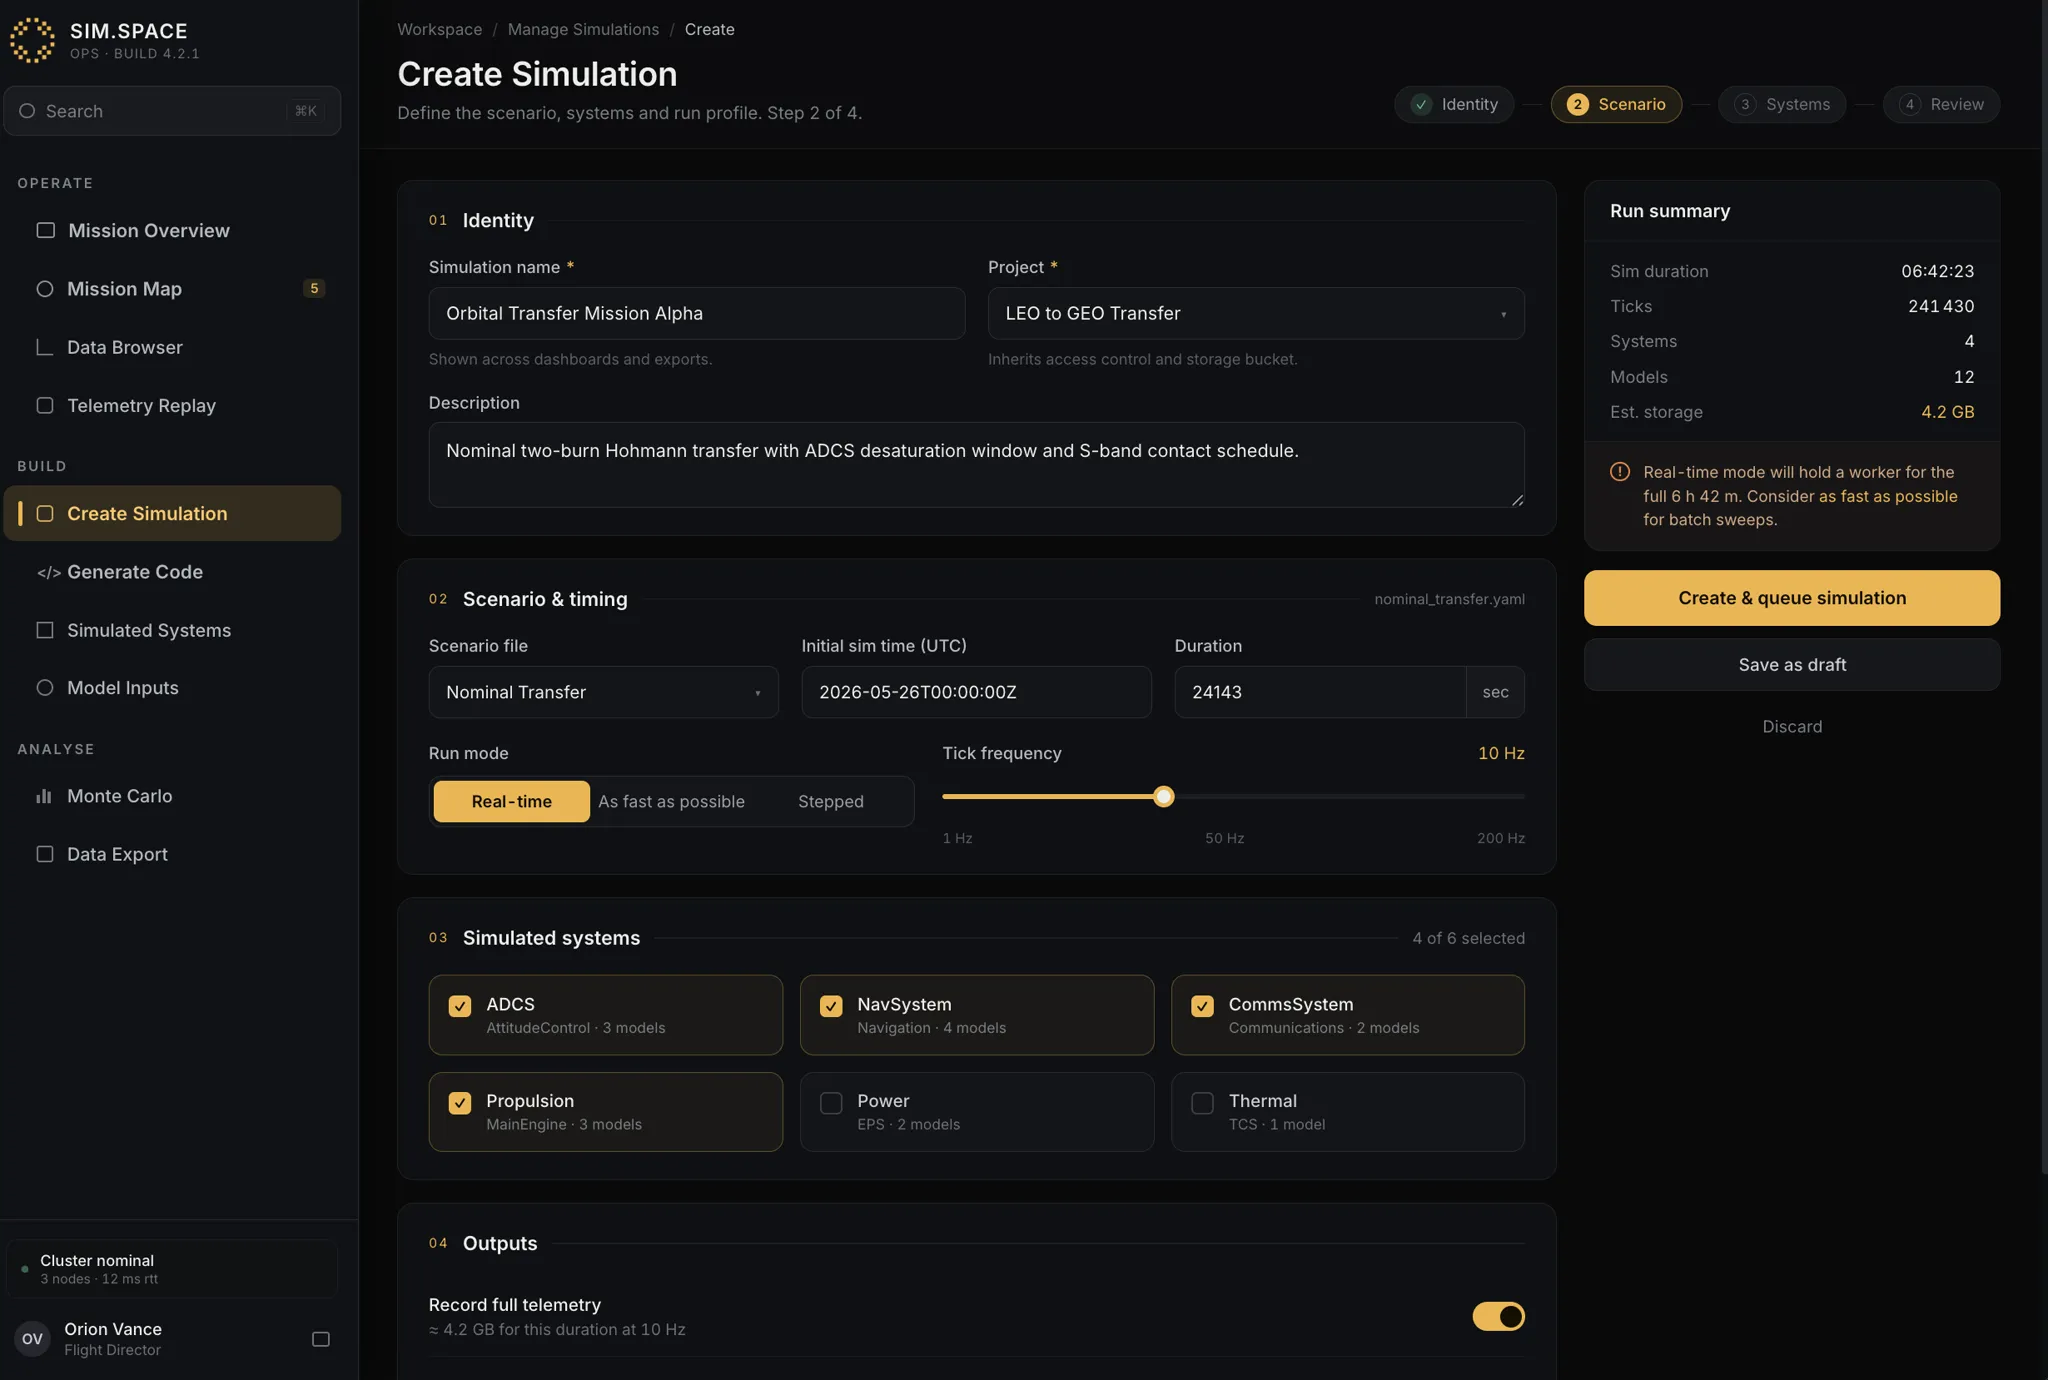
A creation flow configures executable paths, scenario files, initial conditions and the server node that will run the session.
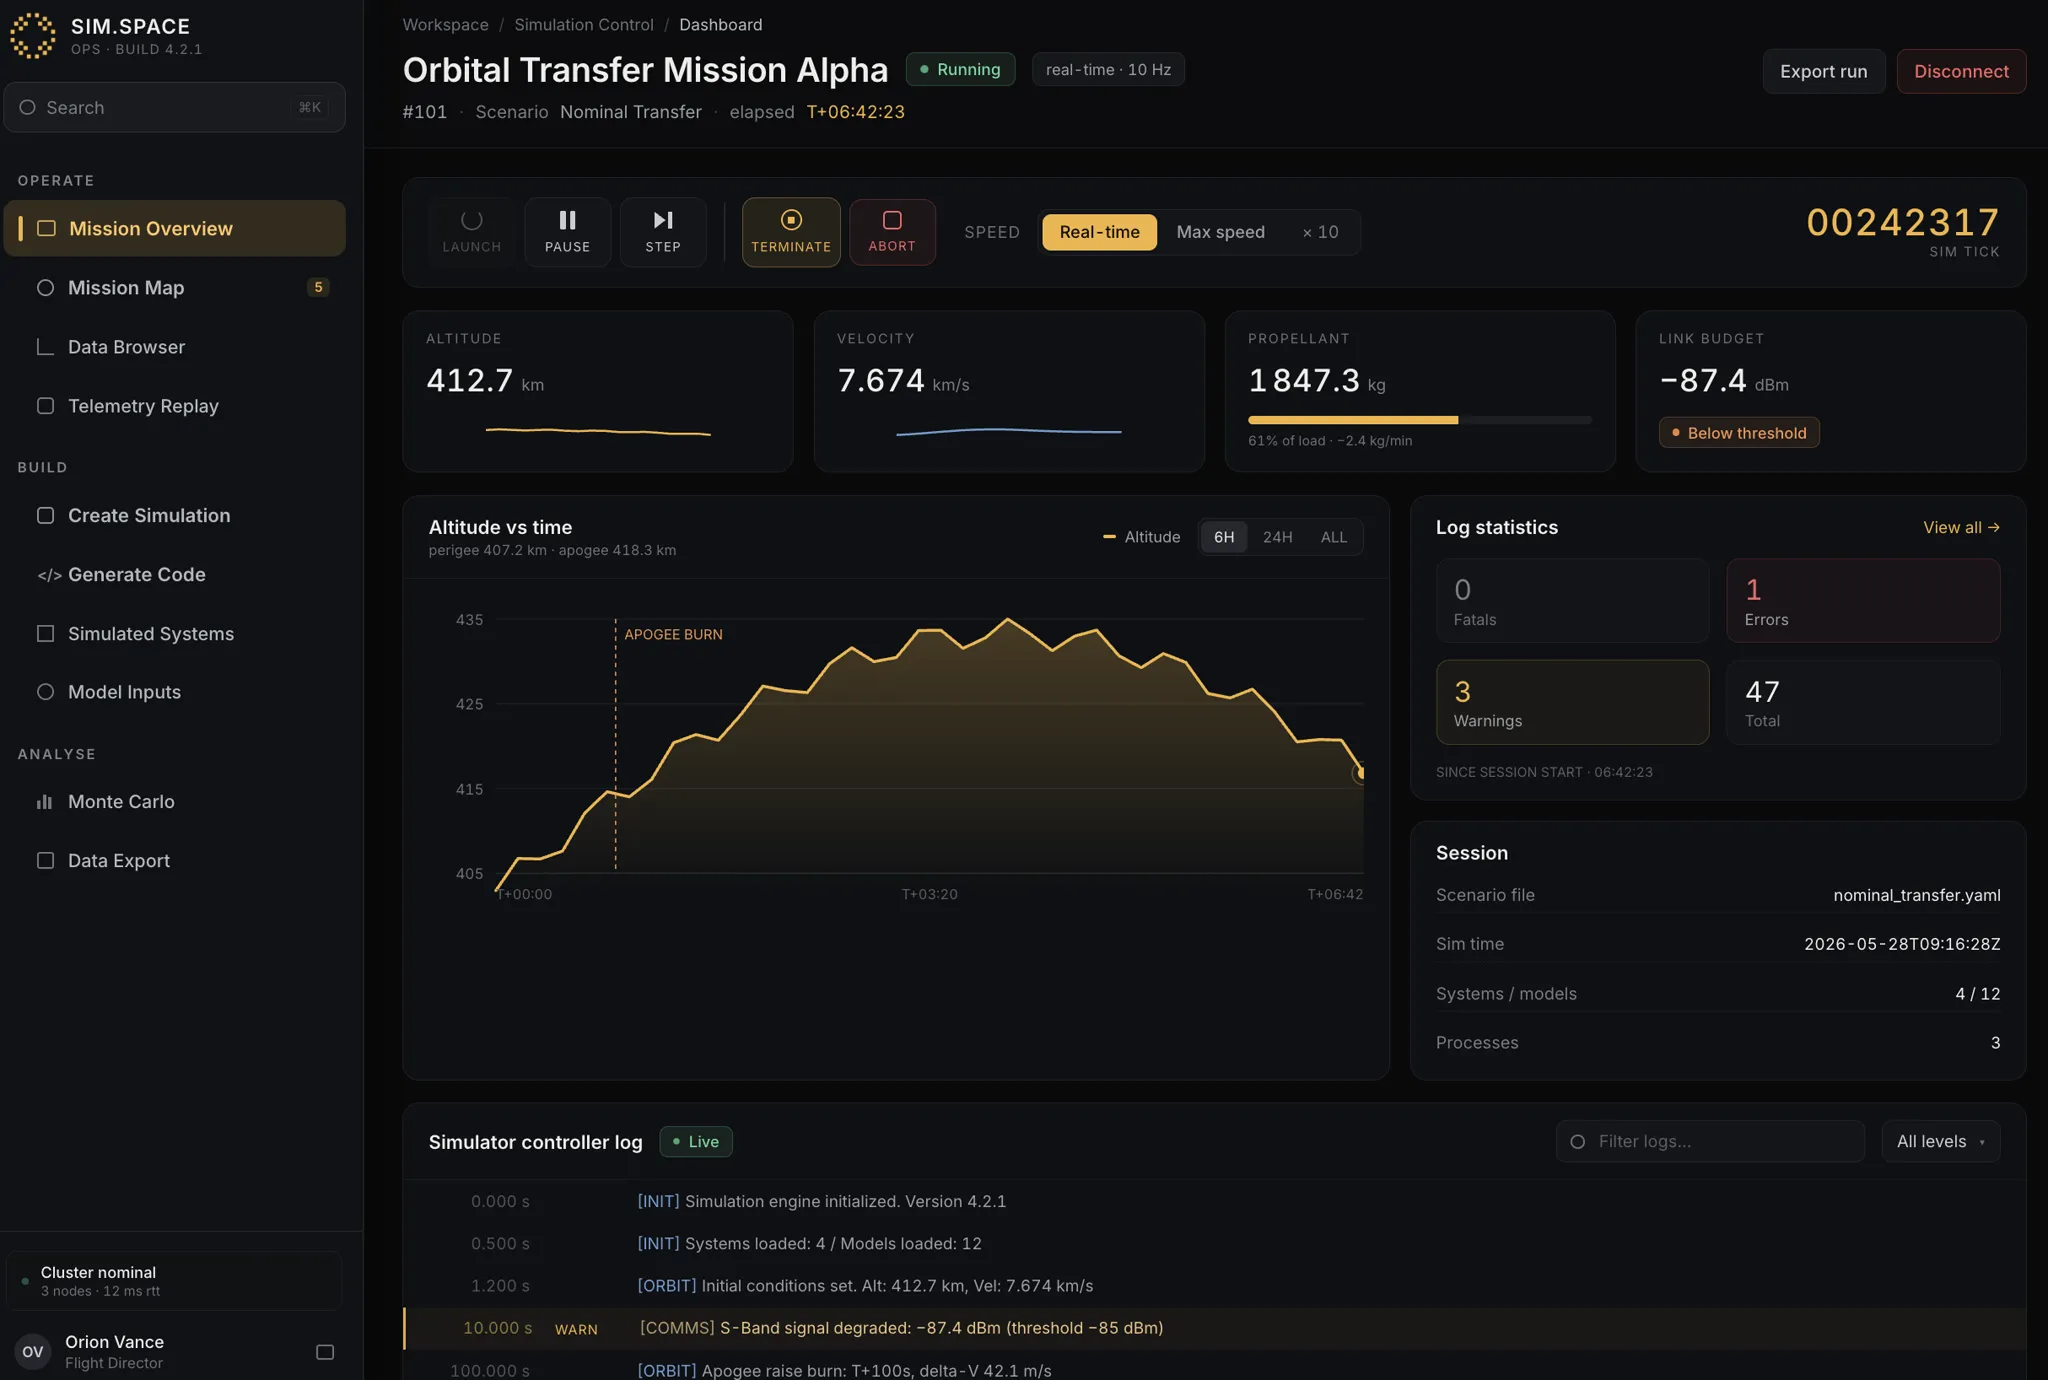
During a live run the mission dashboard shows session status, elapsed time and tick count, with Launch, Pause, Step and Abort controls.
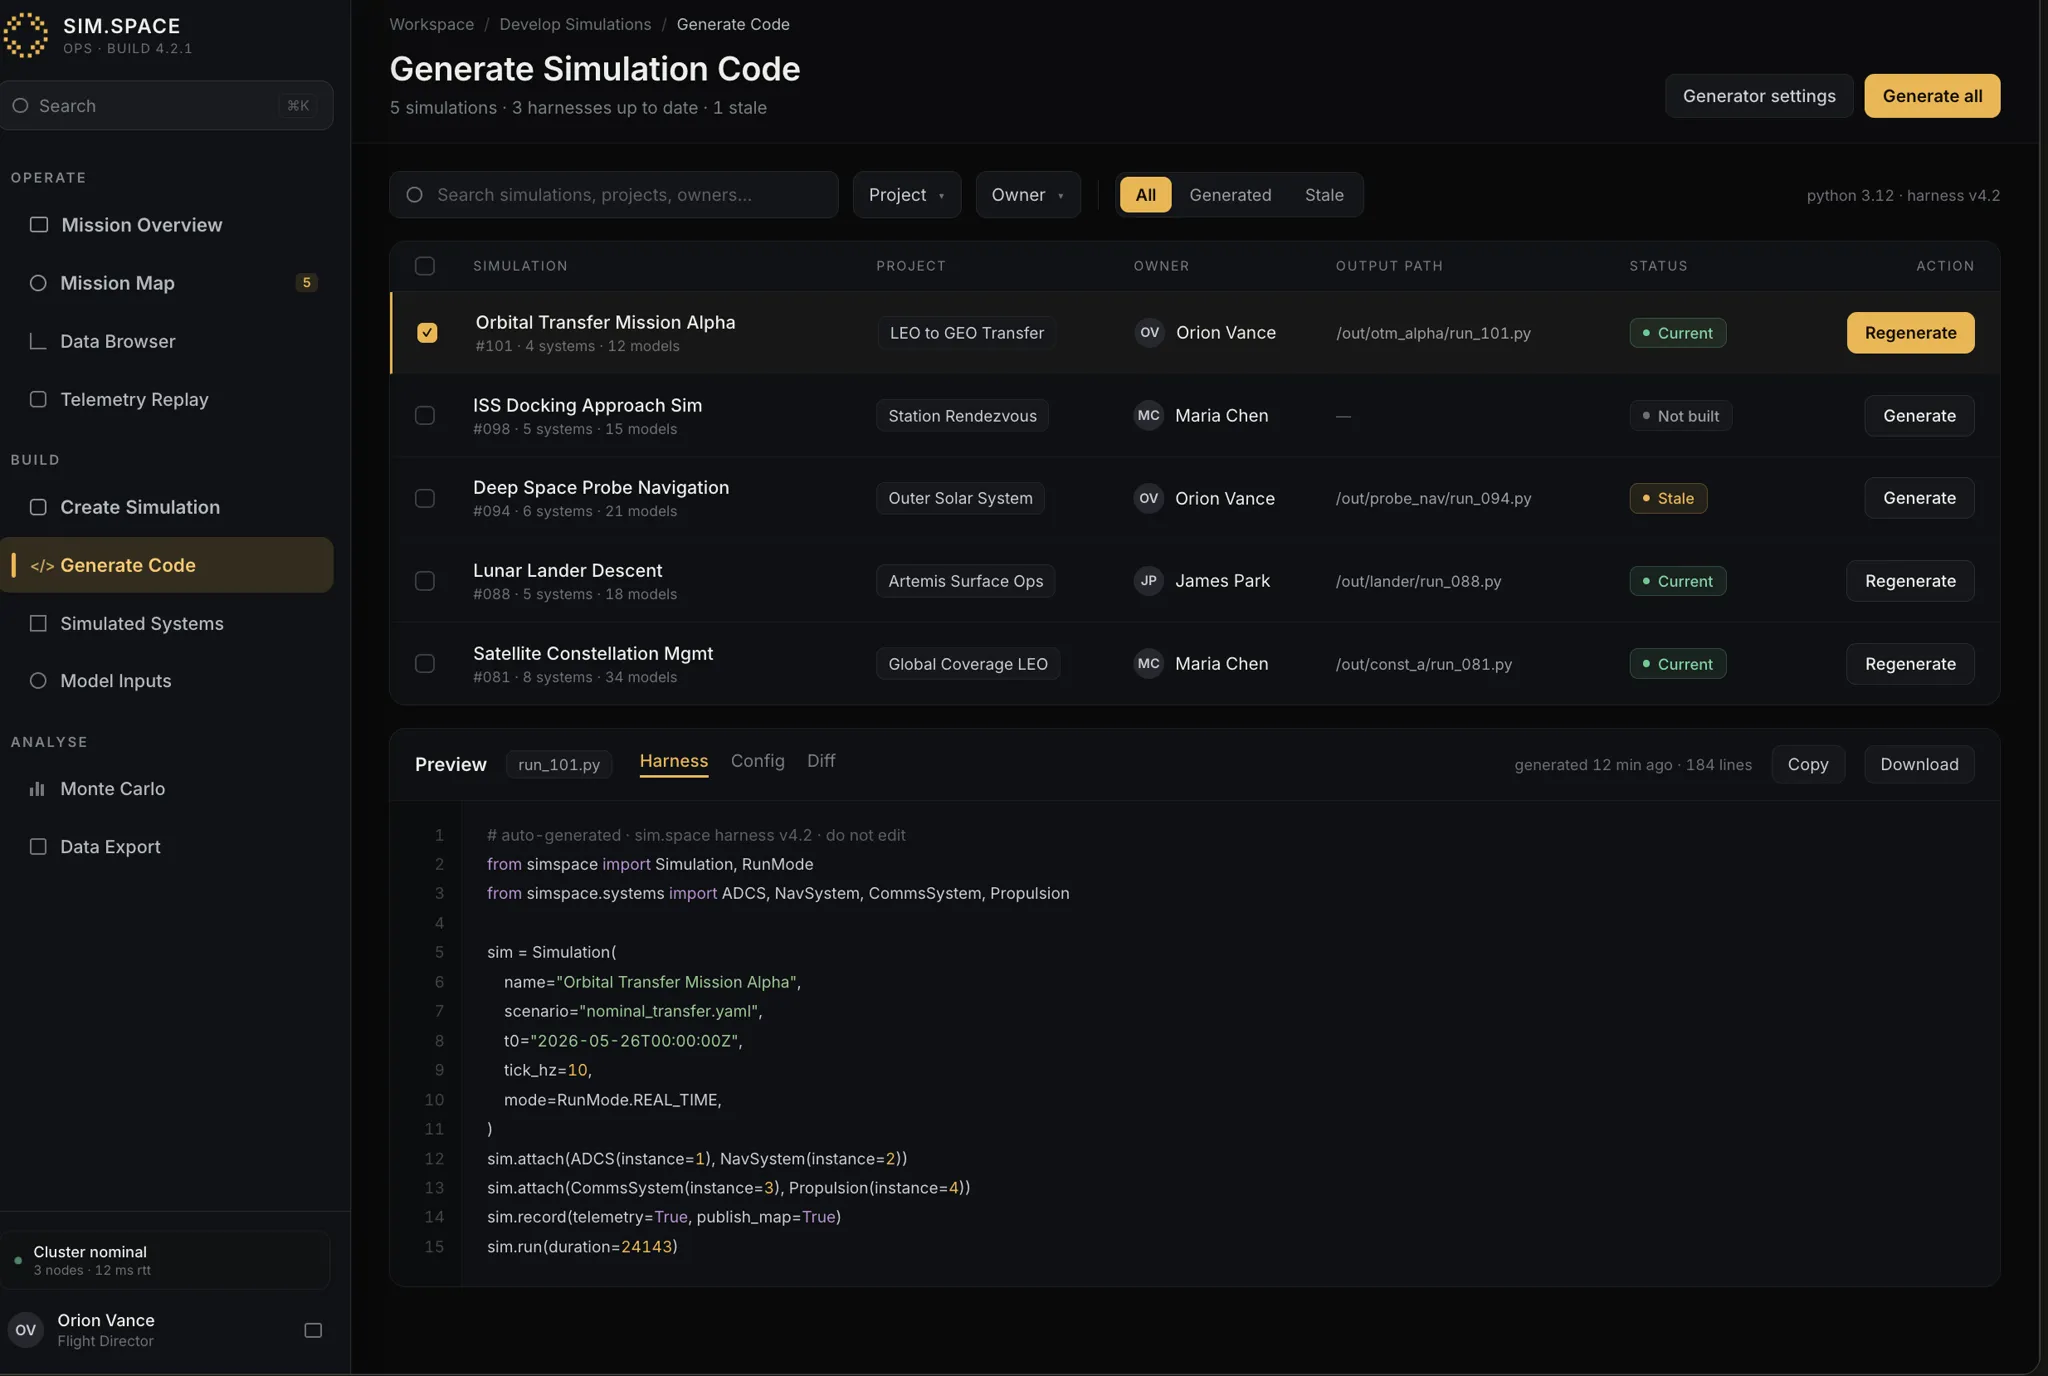
The generate-code workflow produces deployment artifacts from a configured simulation, ready for the target server node.
- Aerospace and defence simulation
- Full frontend build, embedded alongside the client's single backend engineer
- React, TypeScript and Redux, moving onto WebSockets for live data, with charting and mapping libraries for the telemetry plots and the mission map
The client had written the API himself and was, on his side, a team of one. That shaped the engagement more than the domain did: the data contract became something we worked out together rather than a specification handed to us, with us sending back the structures the interface needed and the two halves going up in parallel. We took the frontend from nothing, building the dashboard across all activity, a page for each individual simulation, and the flow for creating a new one.
The recurring request was for more dashboards that were mostly alike and different in the details, so we answered it once. A reusable set of widgets (tables, charts, plots, the mission map) meant a new page composed what it needed instead of reimplementing it, and every screen after the first became cheap. The harder problem was that everything on screen was live. The first version asked the API again for whatever had changed, which worked and did not scale, so we moved the platform onto streaming and then spent a serious share of the engineering on making sure a one-second tick redraws only what actually changed. All of it was hand-built, before AI assistance was part of how anyone worked.
The product was private by design, launched by its operators inside a closed environment rather than sold in the open, and it was shown at an aerospace industry event. Work stopped when the goal had been met.
The dashboard was built, integrated, tested in real use and fixed on the feedback that came back. The client's people ran it, and it was presented at an aerospace industry event. The engagement wound down because that goal was met, not because it stalled.
There is no usage number to quote. The product ran locally in a closed environment with no public deployment, so adoption metrics do not exist. The result is the distance travelled: from an API with no interface to a working real-time mission dashboard in front of an industry audience.